
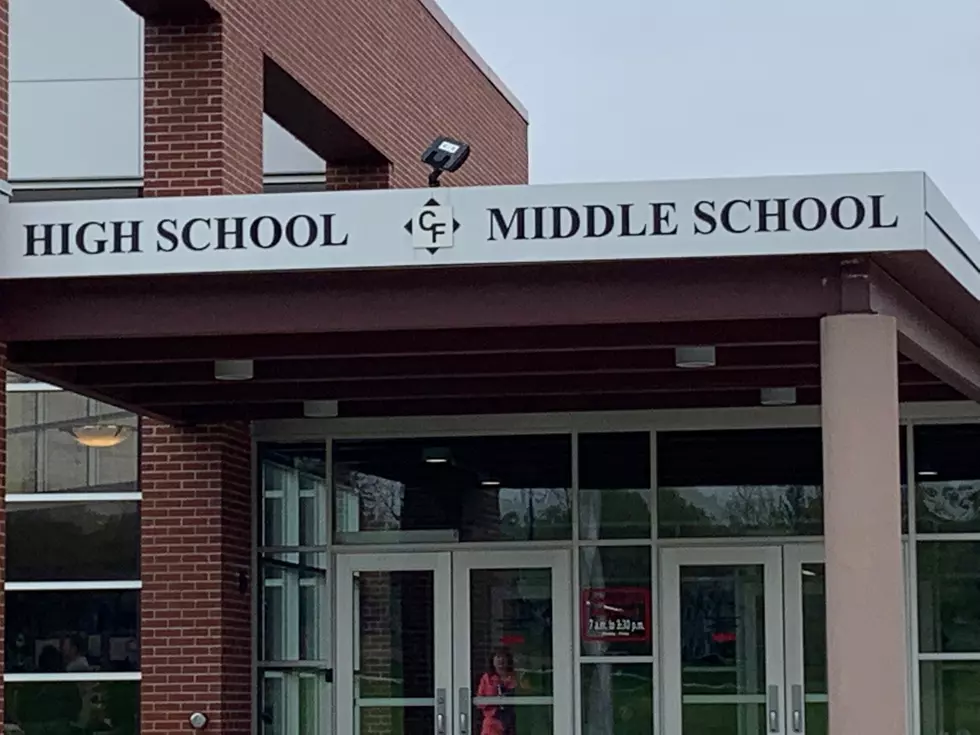
Cannon Falls Most Equitable School District in Minnesota
WalletHub scored 329 school districts in Minnesota based on two metrics, average household income and expenditures for public elementary and secondary schools per pupil.
The results put Cannon Falls at the head of the class in terms of equitable funding. Owatonna Public School ranked 6th, Lewiston-Altura 7th, Stewartville 11th, Chatfield 15th, Maple River 16th, Alden-Conger 19th, Tri-City United 51st.
Faribault is 83rd, Waterville-Elysian-Morristown 90th, Kenyon-Wanamingo 100th, Lake City 102nd, Kasson-Mantorville 130th, Medford 144th, Hayfield 158th, Waseca 160th.
Triton 163rd, Rochester 177th, Zumbrota-Mazeppa 194th, Austin 217th, NRHEG 221st, United South Central 224th, Northfield 235th, Byron 246th, Randolph 261st, Farmington 290th, New Prague 291st, Rosemount-Apple Valley-Eagan 314th, Lakeville 321st.
WalletHub Financial Writer Adam McCann states in his article that," Minnesota has the 8th most equitable school districts in the United States overall."
I've broken out the Big Nine schools listed here most equitable to least:
- Owatonna- (6) Expenditures per Pupil $12,416 with Average Household Income $69,265.
- Winona- (64) Expenditures per Pupil $14,307 with Avg Household Income $54,438.
- Red Wing- (78) Expenditures $12,826 with Avg. Income $61,208
- Faribault- (83) Expenditures $14,344 with Avg. Income $64,844
- Mankato- (131) Expenditures $12,299 Avg. Income $60,731
- Albert Lea- (150) Expenditures $13,987 Avg. Income $50,970
- Rochester- (177) Expenditures $12,715 Avg. Income $78,850
- Austin- (217) Expenditures $13,220 Avg. Income $50,631
- Northfield- (235) Expenditures $13,517 Avg. Income $78,949
Here is the Gopher Conference rankings according to this study.
- Maple River- (16) Expenditures $$12,734 Avg. Income $68,467
- Janesville-Waldorf-Pemberton- (63) Exp. $13,211 Income $69,336
- Blooming Prairie- (77) Exp. $11,020 Income $70,726
- Waterville-Elyisan-Morristown- (90) Exp. $12,577 Income $74,535
- Kenyon-Wanamingo- (100) Exp. $13,272 Income $71,573
- Medford-(144) Expenditures $9,884 Income $72,857
- Hayfield-(158) Expenditures $11,614 Income $63,125
- Triton-(163) Expenditures $10,173 Income $70,449
- New Richland-Hartland-Ellendale-Geneva- (221) $10,593 $64,276
- United South Central-(224) $12,456 $54,066
- Randolph-(261) $10,561 $97,625
Hiawatha Valley League rankings of Most to Least equitable:
- Cannon Falls- (1) $11,535 $73,539
- Stewartville- (11) $9,857 $83,105
- Goodhue-(67) $9,971 $77,188
- Pine Island-(75) $10,267 $85,745
- Lake City-(102) $10,850 $69,488
- Kasson-Mantorville-(130) $9,914 $91,036
- Waseca-(160) $12,787 $56,768
- Zumbrota-Mazeppa-(194) $11,245 $87,646
- Byron-(246) $9,956 $98,517
Here are some other area school district numbers:
Alden-Conger-(19) $12,711 $66,250
LeSueur-Henderson-(26) $11,360 $72,898
Dover-Eyota-(41) $10,508 $75,972
Tri-City United-(51) $11,106 $71,862
Wabasha-Kellogg-(55) $14,168 $63,977
Cleveland-(59) $10,508 $83,333
Belle Plaine-(70) $9,526 $89,208
Grand Meadow-(98) $12,074 $63,750
Glenville-Emmons-(118) $16,025 $58,472
Lanesboro-(173) $11,538 $62,500
Fillmore Central-(178) $11,747 $61,086
Mabel-Canton-(184) $12,237 $58,088
Plainview-Elgin-Millville (185) $9.629 $71,765
Caledonia-(204) $11,999 $58,086
St. Paul-(208) $16,741 $59,717
Jordan-(239) $11,039 $92,210
Spring Grove-(247) $12,524 $51,855
Shakopee-(263) $11,707 $91,957
Lyle-(273) $11,884 $51,667
Southland-(278) $15,155 $75,612
Minneapolis-(280) $17,040 $66,068
Bloomington-(286) $14,945 $78,124
Farmington-(290) $11,096 $98,918
New Prague-(291) $10,474 $102,225
Burnsville-(302) $14,782 $81,651
Rosemount-Apple Valley-Eagan-(314) $12,624 $99,887
Prior Lake-Savage-(318) $11,198 $112,545
Lakeville-(321) $12,696 $112,975
Eden Prairie-(323) $13,678 $115,009
The school district with the highest average family income is Minnetonka $130,482.
Nett Lake provides the largest expenditure per pupil for public elementary and secondary $44,250. Their average household income is $30,278
Check out our NEW Minnesota High School Sports Scoreboard! You can quickly and easily check mn sports scores sorted by school, sport, conference, or football district.
For the best experience, download our Free App to check Minnesota State High School Sports Scores on the Go📲

LOOK: Here is the richest town in each state
Gallery Credit: Meagan Drillinger
More From KDHL Radio